Introduction
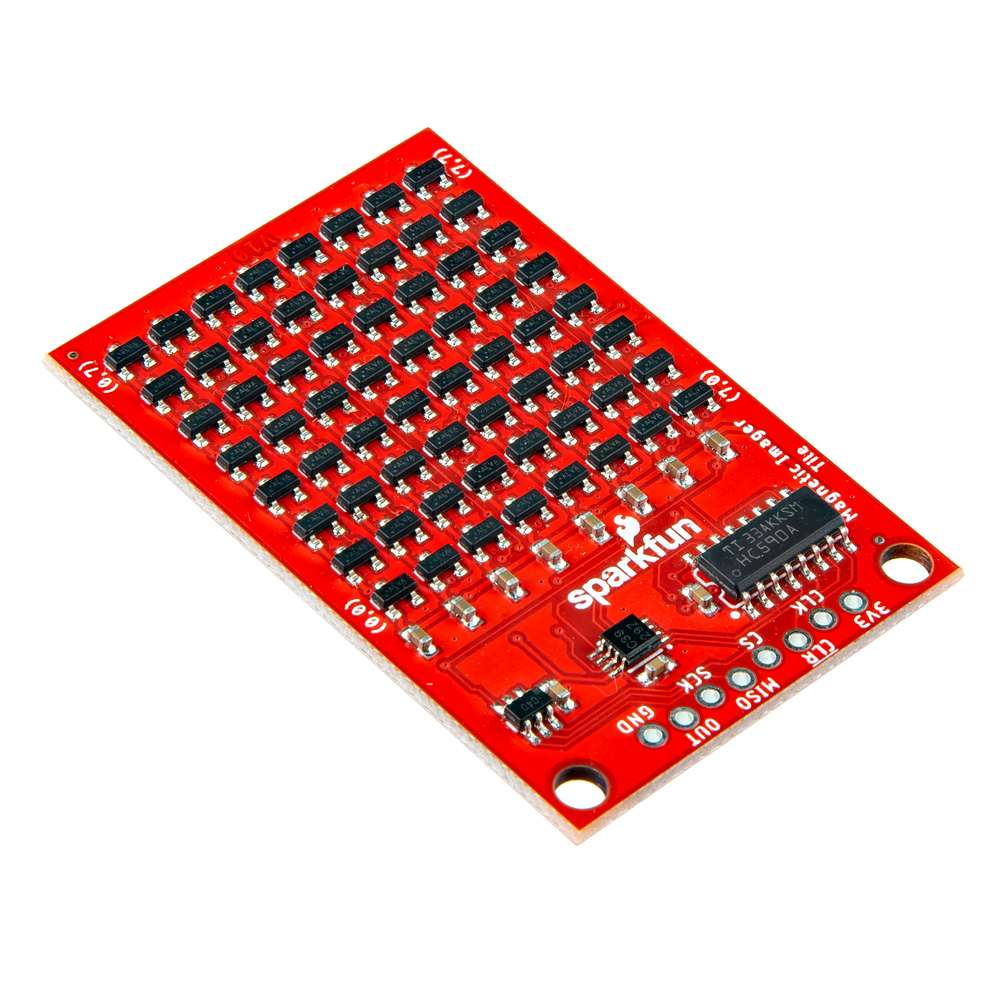
The SparkFun Magnetic Imaging Tile - 8x8 uses an array of 64 hall effect sensors to convert magnetic fields to the visual spectrum. That's right! You can now see magnetic fields in real time! As is to be expected, there are caveats: the magnetic sensors used on the tile are some of the most sensitive on the market but you need to be within 1 to 2 centimeters of the tile to get a good image.
The demo shown in the animated GIFs don't quite give the Magnetic Imaging Tile justice! The frame rate of gifs is too low! Please see Peter's demo video for some amazing visuals.
In this tutorial, we'll go over the hardware and how to hookup the sensor to an Arduino. We will also go over an Arduino and Processing example to get started.
Required Materials
To follow along with this tutorial, you will need the following materials. You may not need everything though depending on what you have. Add it to your cart, read through the guide, and adjust the cart as necessary.
Other Microcontrollers
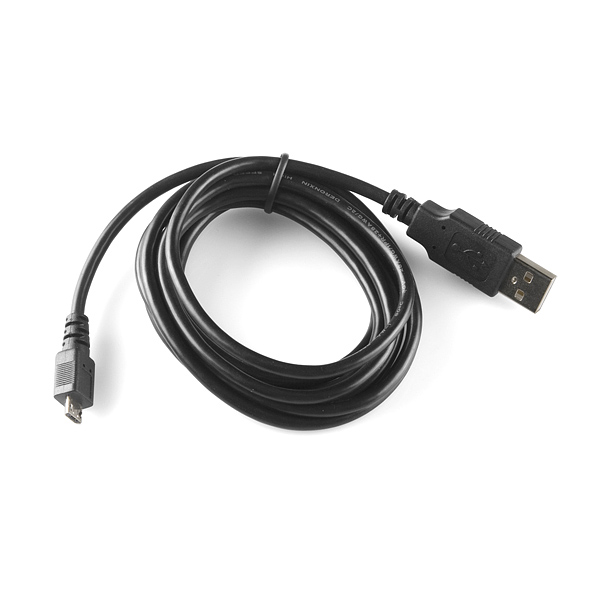
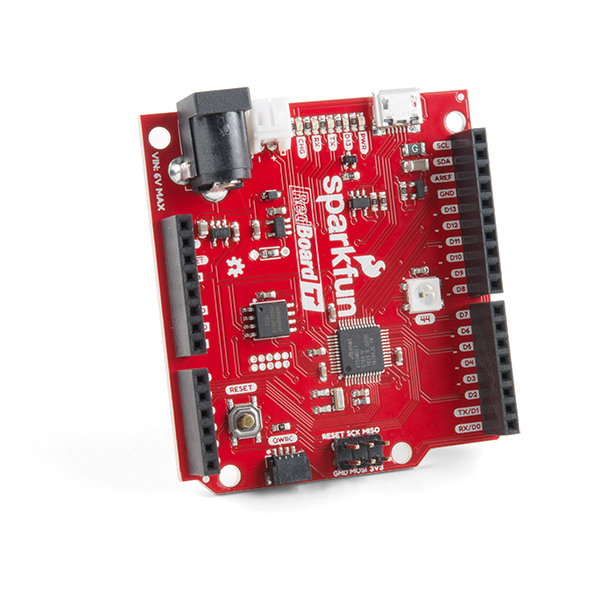
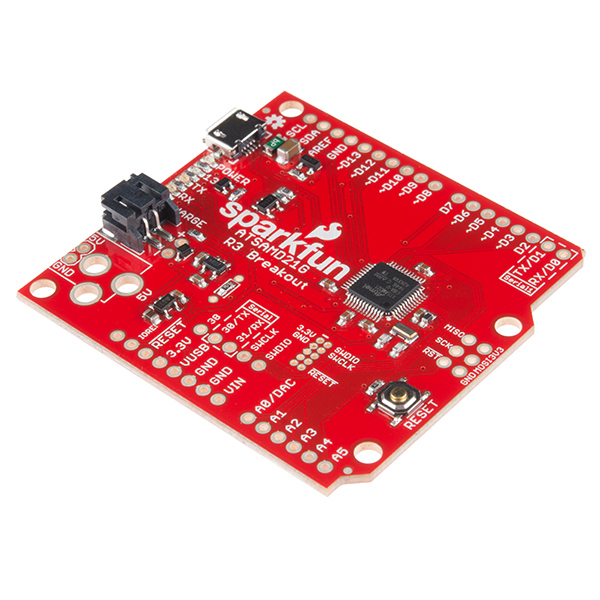
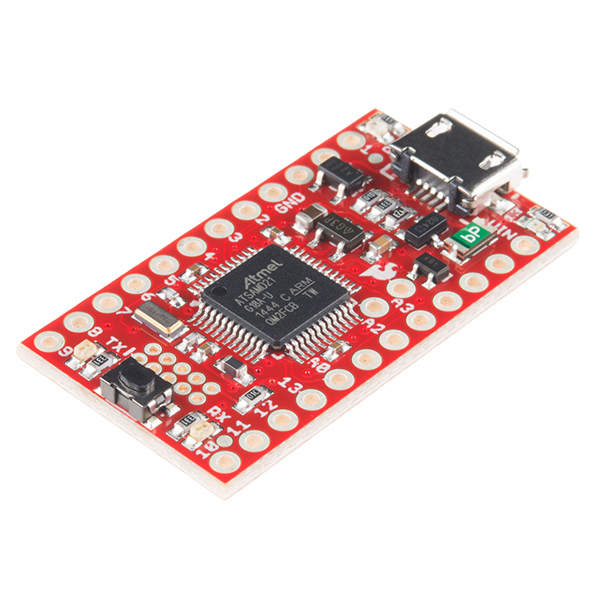
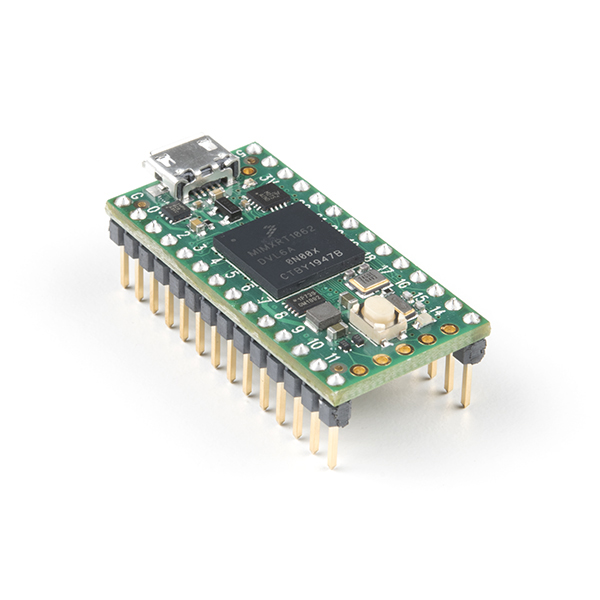
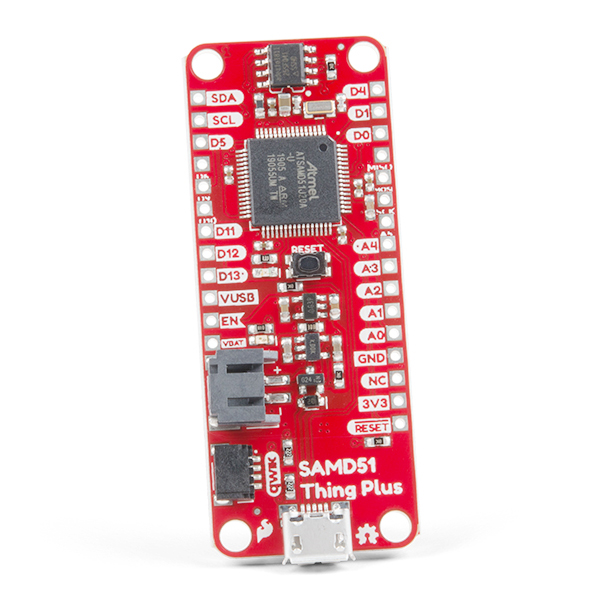
We'll be using the RedBoard Turbo - SAMD21 Development Board for the examples in this tutorial. The Arduino code also compatible with SAMD microcontrollers like the SAMD21 Dev Breakout, SAMD21 Mini Breakout, and SparkFun Thing Plus - SAMD51. You can also use a Teensy as well. Just make sure to solder headers (or wires) to the board and include a compatible USB cable with the development board.
While the ChipKit MAX32 is not listed in the SparkFun catalog, you can also use it with the Magnetic Imaging Tile.
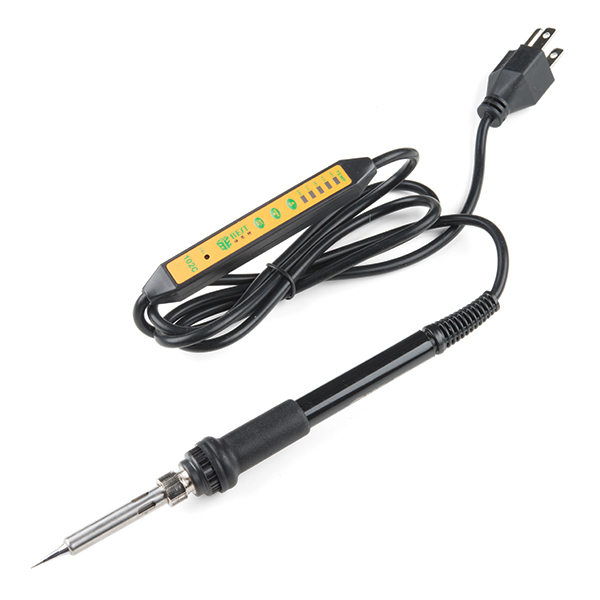
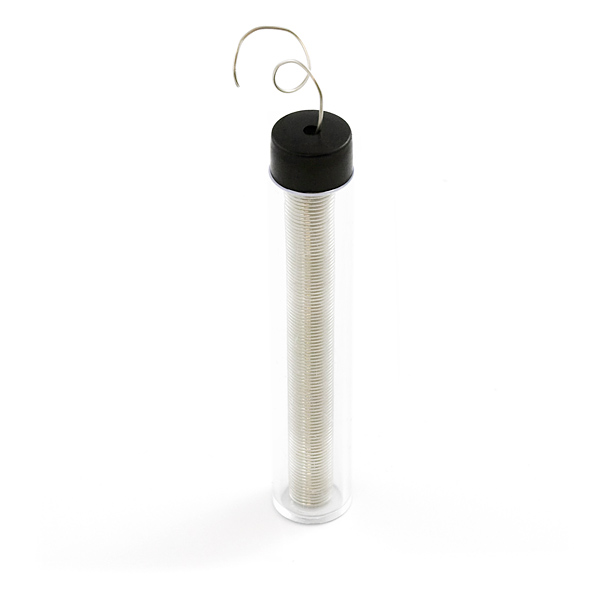
Tools
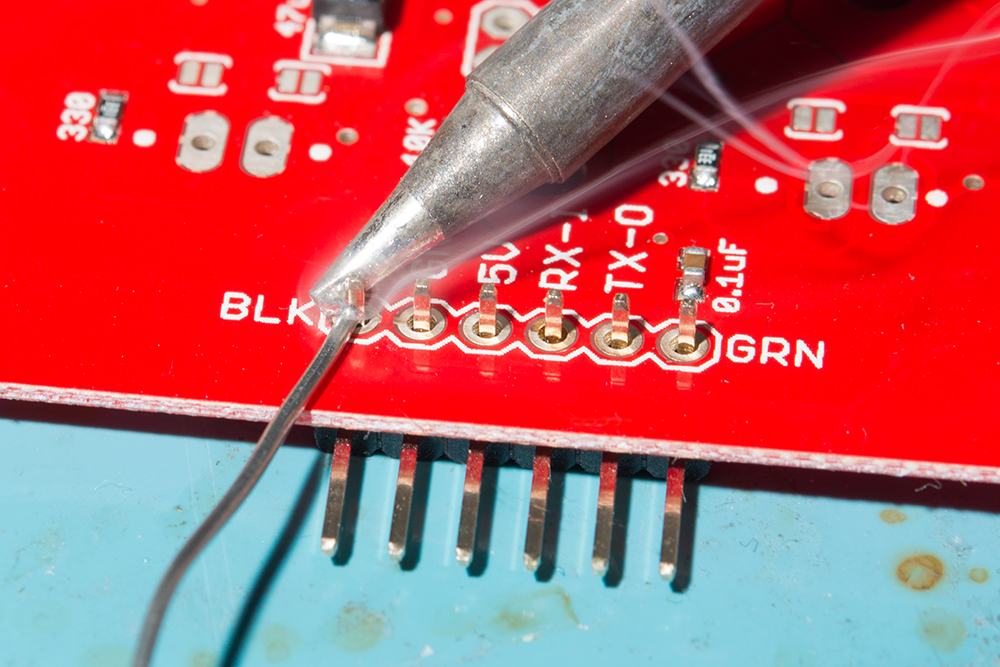
You will need a soldering iron, solder, and general soldering accessories for a secure connection when using the plated through holes.
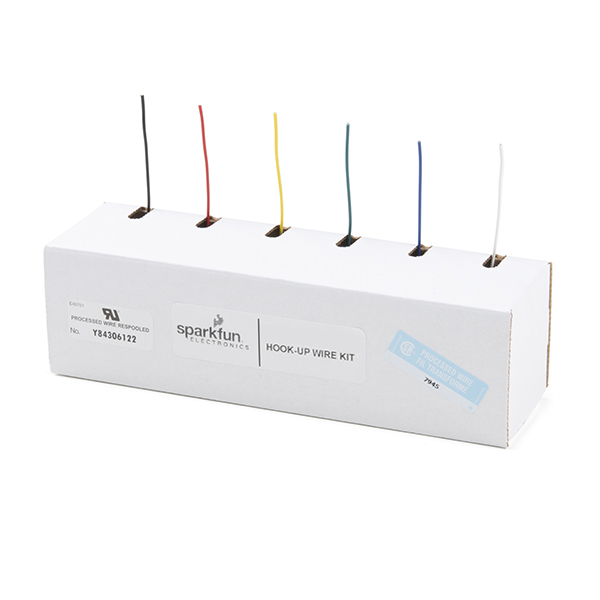


Prototyping Accessories
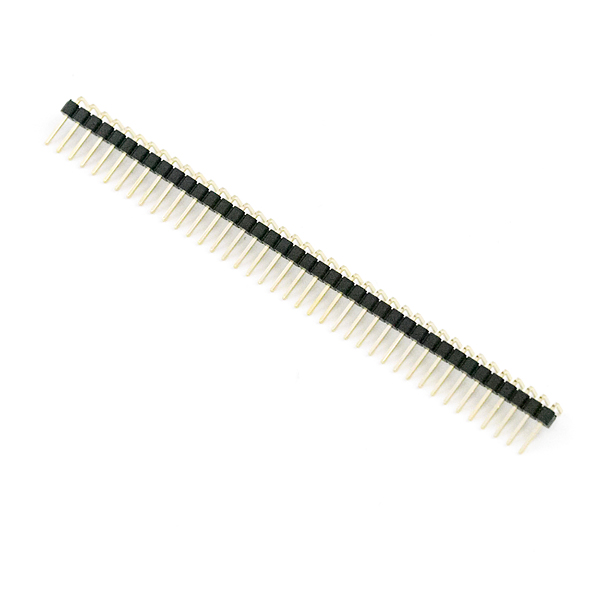
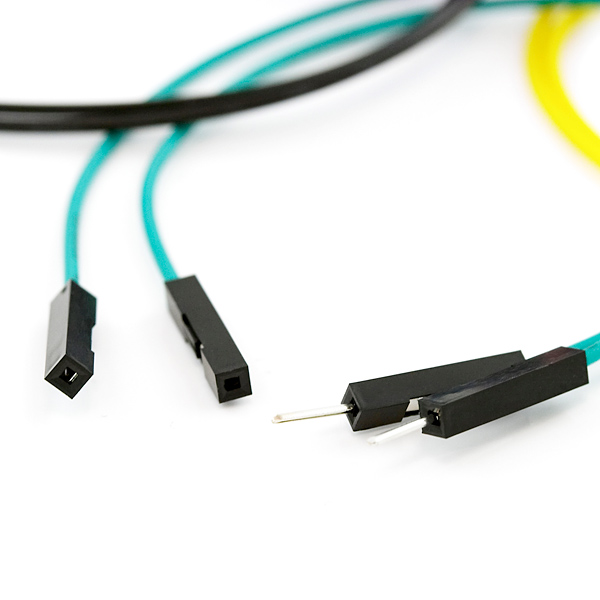
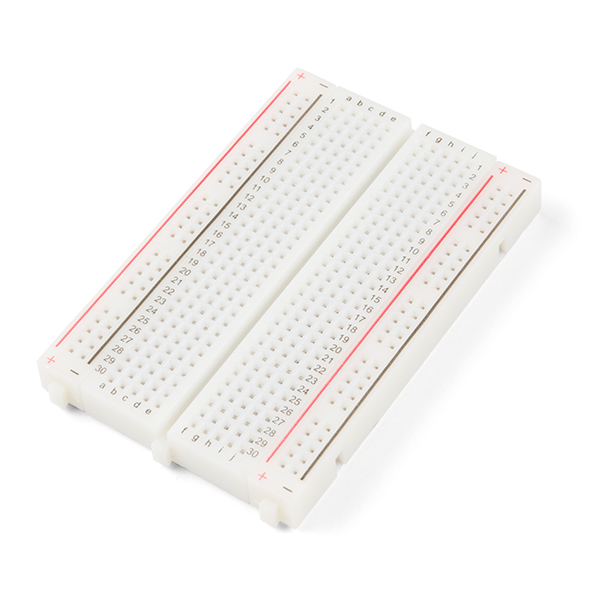
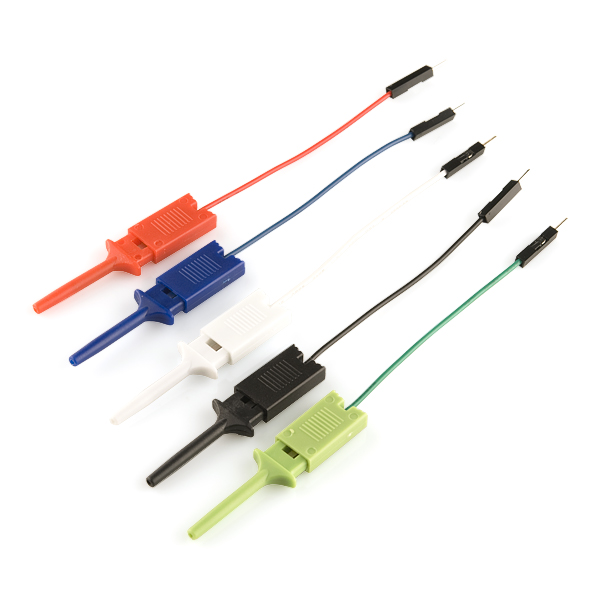
Depending on your setup, you may want to use IC hooks for a temporary connection. However, you will want to solder header pins to connect devices to the plated through holes for a secure connection. We opted for right angle headers for the SparkFun Magnetic Imaging Tile as well as M/F jumpers to connect to the SparkFun RedBoard Turbo - SAMD21 Development Board to reduce the amount of soldering.
Suggested Reading
If you aren’t familiar with the following concepts, we also recommend checking out a few of these tutorials before continuing.


Note
This is a collaboration with Peter Jansen of the "Open Source Science Tricorder Project". All credit goes to him! You can read about his work on the project on Hack A Day.
Hardware Overview
In this section, we will highlight the hardware and pins that are broken out on the SparkFun Magnetic Imaging Tile - 8x8. We'll refer to the "top" side of the board as the side with the 8x8 array of hall effect sensors. The "bottom" side of the board will be the side with the multiplexors. For more information, check out our Resources and Going Further on the components used for the sensor.
 |
 |
| Top View | Bottom View |
Note
SparkX re-designed version 3.0's PCB for DFM and simplified some of the platform interfacing code. This design was transferred to SparkFun red and labeled as v1.0. Besides the color of the PCB and a few minor silkscreen changes, the boards are functionally the same.
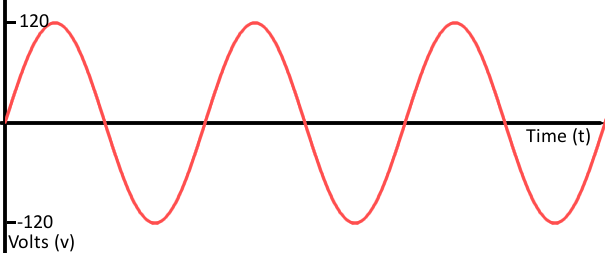
The major advancement of the current design (SparkX v3.0, SparkFun v1.0) is a dramatic increase in the speed with which the tile data can be read out. ~2000 frames per second (fps) can be achieved which allows visualizing even quickly varying fields (e.g. those in a 60Hz transformer, or a moving motor). Version 3.0 reduces the size of the tile to an 8x8 grid of hall effect sensors (64 total), arrayed in a 4mm grid. The boards is tile-able with up to 4 of the boards tile-able with minimal borders to create a 16x16 array.
What's with the zig zagging PTH's?
You may be wondering what is going on with the PTH. For those that have been around for a while, you might have noticed PTHs zig zagging on previous board designs. These offset PTHs are meant to "lock" header pins to the board to aid in soldering. For more information on the locking PTHs, check out the Pete's "Sneaky Footprints"!
Power
The 3.3V and ground are broken out on the edge of the board.
- 3V3 / 3.3V — The 3.3V net is labeled as 3V3 or 3.3V. You can apply power to the board if you have a regulated voltage of 3.3V. Otherwise, you could power a separate device through the 3V3 PTH pin.
- While the pin is labeled as 3.3V, you can also safely power the board with 5V as well. The components on the board can handle the voltage.
- GND — Of course, is the common, ground voltage (0V reference) for the system.
 |
 |
| Power and Ground Highlighted (Top & Bottom View) | |
Hall Effect Sensors
The Magnetic Imaging Tile consists of 64x analog hall effect sensors arranged in an 8x8 grid. The specific hall effect sensor used is DRV5053VA with a sensitivity of -90mV/mT. The coordinates of each sensor is indicated by the silkscreen by the corners of the 8x8 array of hall effect sensors.
 |
| Hall Effect sensors Highlighted/i> |
Counter, Decoder, Muxes, and ADC
The circuit includes an SN74HC590A 8-bit binary counter (the 14-pin IC on the top of the board), SN74LVC1G139 decoder (the 8-pin IC on the top of the board), four CD74HC4067 multiplexors (the 4x ICs on the back of the board), and the AD7680 16-bit ADC (the 6-pin IC on the top of the board). Together (with some code loaded on a microcontroller), the components output the analog readings from the 64x hall effect sensors through SPI.
 |
 |
| Counter, Decoder, ADC Top View | Mux Bottom View |
With a 16-bit ADC and a 3.3V range, this is approximately 50mV per bit. The Magnetic Imaging Tile is able to detect roughly +/- 0.5mT per bit. For our demo in the GIF we used a RedBoard Turbo with the SAMD21 to clock out the ADC data to the serial port at 115200. The serial is then parsed by a Processing sketch. This setup can achieve over 76 frames per second. With buffering the setup is capable of 200 fps. The ChipKit MAX32 is also supported and can achieve around 2,000fps. A faster processor should be able to achieve 1500fps (the 100kSPS limit of the ADC). The raw analog signal is also exposed. This allows processors that have built-in faster ADC to convert the signal directly. The theoretical limit of the DRV5053 is around 20,000 fps but would require a very fast ADC.
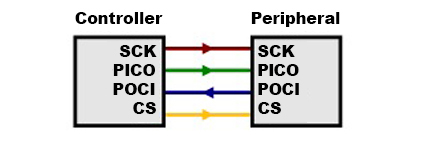
SPI
The SPI port is broken out on the edge of the board. This connects to the AD7680 adc.
- MISO — Peripheral out, central in. The conversion from the AD7680 is provided on this output data pin.
- CLK (top side) / SCK (bottom side) — Serial clock input.
- CS — Chip select. This is active when pulled low.
 |
 |
| SPI Pins Highlighted (Top & Bottom View) |
|
Note
On the top side of the board, the serial clock is labeled as SCK. On the bottom side of the board, the serial clock in is labeled as CLK. Make sure to connect the serial clock located between the analog out and MISO pins.
Additional Pins Broken Out
The following pins are also broken out on the board.
- CLR — Clear counter input pin. This is connected to the SN74HC590AN.
- CLK (Top side) / SCK (bottom side) — Counter clock input. This is connected to the SN74HC590AN.
- OUT or AOUT — This is connected to the AD7680's analog input. This is connected to the multiplexors as well.
 |
 |
| Additional Pins Broken Out Highlighted (Top & Bottom View) |
|
Note
On the top side of the board, the counter clock pin is labeled as CLK. On the bottom side of the board, the counter clock in is labeled as SCK. Make sure to connect to the counter clock pin between the counter clear and 3.3V pin.
Board Dimensions
The board is 1.35" x 2.05" (34.29mm x 52.07mm). There are 2x mounting holes by the PTHs. You can use 4-40 standoffs to mount the board to a panel or enclosure.
 |
| Board Dimensions |
Hardware Hookup
Connecting via PTH
For temporary connections to the PTHs, you could use IC hooks to test out the pins. However, you'll need to solder headers or wires of your choice to the board for a secure connection. You can choose between a combination of header pins and jumper wires, or stripping wire and soldering the wire directly to the board.

For the scope of this tutorial, we will use right angle, male headers. Insert the right angle headers on the top side and solder the header pins from the bottom. Of course, you can also insert the right angle header so that the pins face toward the multiplexors similar to Peter's demo video.
 |
| Headers Being Soldered to the Magnetic Imaging Tile |
| Magnetic Imaging Tile Pinout |
SAMD21 Pinout (i.e. RedBoard Turbo, SAMD21 Mini, etc.) |
Teensy Pinout (i.e. Teensy v3.1, v3.5, v4.0, v4.1, etc.) |
SAMD51 Pinout (i.e. SAMD51 Thing Plus, etc.) |
|---|---|---|---|
| GND | GND | GND | GND |
| OUT | A1 | A1 | A1 |
| SCK | 13 | 13 | 24 |
| MISO | 12 | 12 | 22 |
| CS | 10 | 10 | 10 |
| CLR | 8 | 8 | 5 |
| CLK | 9 | 9 | 9 |
| 3.3V | 3V3 | 3.3V | 3V3 |
Note
If you are using a development board with updated SPI terminology, MISO may be labeled as POCI.
We will be using the RedBoard Turbo with female headers already installed on the board. For users that are using a different board, now would be a good time to solder headers or wires to the board. Below is an example with female headers soldered on the SAMD51 Thing Plus. Additionally, there are stackable headers soldered on the SAMD21 Mini Breakout so that the board can be inserted into a breadboard.
 |
| Headers soldered on the SAMD51 Thing Plus and SAMD21 Mini Breakout |
Connecting a Micrcontroller to the Magnetic Imaging Tile
We recommend using a microcontroller with sufficient RAM. While the example code can compile and function with Arduinos with an ATmega328P, the frames are limited. For the scope of the tutorial, we used a SAMD21. Of course, users can also use a Teensy and ChipKit as well.
Below is the Fritzing diagram of the RedBoard Turbo - SAMD21 connected to the Magnetic Imaging Tile.
 |
| Fritzing Diagram of RedBoard Turbo SAMD21 Connected to Magnetic Imaging Tile |
After soldering headers to the Magnetic Imaging Tile, wire the board to the RedBoard Turbo using jumper wires. Then connect a micro-b USB cable to power and program the RedBoard Turbo.
 |
| RedBoard Turbo - SAMD21 Connected to Magnetic Imaging Tile |
You can also connected any SAMD21 to the Magnetic Imaging Tile. Below shows a Fritzing diagram of the SAMD21 Mini Breakout connected to the Magnetic Imaging Tile. When using other development boards, you may need to solder additional headers or wires to the board. Depending on the microcontroller, you may also need to redefine the pins in the Arduino example code in order to properly connect to the SPI port.
 |
| Fritzing Diagram of SparkFun SAMD21 Mini Breakout Board Connected to Magnetic Imaging Tile |
After soldering headers (or wires) on your microcontroller and Magnetic Imaging Tile, wire the boards together. The connect a micro-b USB cable to power and program the SAMD21 Mini Breakout.
 |
| SAMD21 Mini Breakout Connected to Magnetic Imaging Tile |
Setting Up Arduino
Arduino
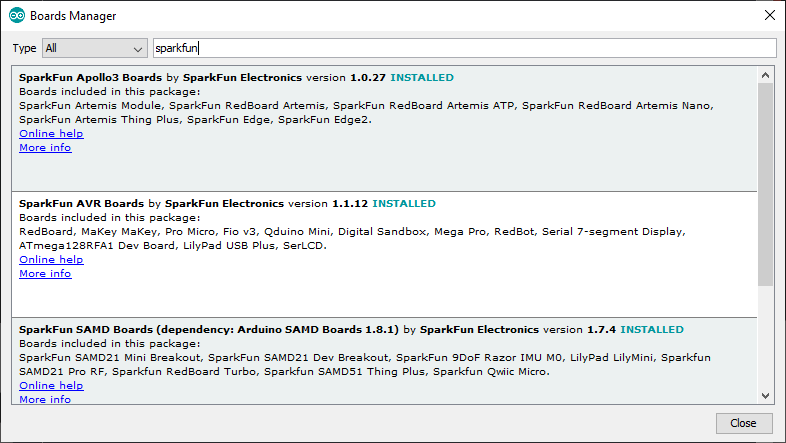
This example assumes you are using the latest version of the Arduino IDE on your desktop. If this is your first time using Arduino IDE, library, or board add-on, please review the following tutorials.
Arduino Example
This example is located in the Magnetic Imaging Tile's Hardware Repo. To grab it, go ahead and download or clone the SparkFun Magnetic Imaging Tile hardware repo.
Upload Arduino Example
After unzipping the compressed files, navigate to the hardware repo's folder and open the example: ... SparkFun_Magnetic_Imaging_Tile > Software > arduino > Example1_Basic_Readings > Example1_Basic_Readings.ino. This sketch listens for a character before parsing the data. For users using an Arduino microcontroller, select your board in the Tools menu (in our case the SparkFun RedBoard Turbo) and the correct Port it enumerated on.
You can also copy or paste the code as shown below. Then click "Upload".
/*
 This basic example shows how to interface with the Magnetic Imaging Tile V3
 with a Chipkit MAX32, with data displayed via the serial port.
 Simple serial commands allow viewing the data in a serial console, or
 sending the data to a program on a host system (such as the accompanying
 Processing example) for display.

 The code primarily uses the internal ADC of the Chipkit MAX32, but
 (slow) code is also provided for using the AD7940 on the tile as
 well.  The speed of the ADC and I/O clocking is essentially the
 limiting factor in framerate, and this should be kept in mind
 when porting to other platforms (e.g. the Arduino Uno).

 The Chipkit MAX32 provides ~128K of RAM, which is enough for a
 short framebuffer (up to about 500 frames) when recording
 high-speed data.

 This code was written in MPIDE 0023-windows-20140316 .
*/

////Define where to pipe serial print statements
//#define terminal Serial //Use with Uno, SAMD51, Chipkit
#define terminal SerialUSB //Use with SAMD21

#define CS_INACTIVE  1
#define CS_ACTIVE    0

//Hardware connections
const byte PIN_ANALOG = A1;

//On Arduino Unos and Red Boards this is the SPI pinout

const byte PIN_CLR = 8;
const byte PIN_CLK = 9;
const byte AD7940_SPI_MISO = 12;
const byte AD7940_SPI_CS = 10;
const byte AD7940_SPI_CLK = 13;


// Pins for SAMD51
/*
const byte PIN_CLR = 5;
const byte PIN_CLK = 9;
const byte AD7940_SPI_MISO = 22;
const byte AD7940_SPI_CS = 10;
const byte AD7940_SPI_CLK = 24;
*/

// Frames
#if defined(__AVR_ATmega328P__) || defined(__AVR_ATmega168__)

//We have very limited RAM
#define MAX_BASE_FRAMES  2

#else

//Platforms like SAMD21, ChipKit, and Teensy have far more RAM
//#define MAX_BASE_FRAMES  500
//#define MAX_BASE_FRAMES  250
#define MAX_BASE_FRAMES  100
//#define _8BIT

#endif

#ifdef _8BIT
#define MAX_FRAMES      MAX_BASE_FRAMES*2
uint8_t frames[MAX_FRAMES][64];
#else
#define MAX_FRAMES      MAX_BASE_FRAMES
uint16_t frames[MAX_FRAMES][64];
#endif

// Frame variables
// Magnetic tile reading
int pixelOrder[] = {26, 27, 18, 19, 10, 11, 2, 3, 1, 0, 9, 8, 17, 16, 25, 24};
int subtileOrder[] = {0, 2, 1, 3};
int subtileOffset[] = {0, 4, 32, 36};
uint16_t frame[64];

int numFrames = 0;
int curFrame = 0;

#define MODE_IDLE          0
#define MODE_LIVE          1
#define MODE_HIGHSPEED1    2
#define MODE_HIGHSPEED2    3
#define MODE_HIGHSPEED3    4
#define MODE_HIGHSPEED4    5
#define MODE_PIXEL         6

int curMode = MODE_IDLE;

/*
   Analog Read
*/
int readMagnetometer() {
  //return 0;
  //return analogRead(PIN_ANALOG);
  //return readInternalADC();
  return readAD7940();
  //return read_ad7940();
}

// Take one measurement form the internal ADC
int readInternalADC() {
  int numSamples = 2;
  float sum = 0.0f;
  for (int i = 0; i < numSamples; i++) {
    int sensorValue = analogRead(PIN_ANALOG);
    sum += sensorValue;
  }
  sum /= numSamples;

  //return sensorValue;
  return int(floor(sum));
}


// Take one measurement from an external AD7940 14-bit ADC (SPI)
uint16_t readAD7940() {
  uint16_t value = 0;
  //uint16_t delay_time = 2;

  // Idle
  digitalWrite(AD7940_SPI_CS, HIGH);
  digitalWrite(AD7940_SPI_CLK, HIGH);

  // Enable
  digitalWrite(AD7940_SPI_CS, LOW);

  // Read 16 bits
  for (int i = 0; i < 16; i++) {
    char bit = digitalRead(AD7940_SPI_MISO);
    digitalWrite(AD7940_SPI_CLK, LOW);
    //    delayMicroseconds(delay_time);

    value = value << 1;
    value = value + (bit & 0x01);
    digitalWrite(AD7940_SPI_CLK, HIGH);
    //    delayMicroseconds(delay_time);
  }
  // Disable
  digitalWrite(AD7940_SPI_CS, HIGH);
  //  delayMicroseconds(delay_time);

  return value;
}

/*
   Magnetic Sensors
*/
void clearCounter() {
  digitalWrite(PIN_CLR, 0);
  //delay(10);
  digitalWrite(PIN_CLR, 1);
  //delay(10);
}

void incrementCounter() {
  digitalWrite(PIN_CLK, 1);
  //delay(1);
  digitalWrite(PIN_CLK, 0);
  //delay(1);
}

/*
   Capture one frame from imaging array
*/
void readTileFrame() {

  clearCounter();
  incrementCounter();

  for (int curSubtileIdx = 0; curSubtileIdx < 4; curSubtileIdx++) {
    for (int curIdx = 0; curIdx < 16; curIdx++) {
      // Read value
      int value = readMagnetometer();

      //terminal.println(value);
      //delay(10);

      // Store value in correct frame location
      int frameOffset = pixelOrder[curIdx] + subtileOffset[subtileOrder[curSubtileIdx]];
      //terminal.println(frameOffset);
      //delay(25);
      frame[frameOffset] = value;

      // Increment to next pixel
      incrementCounter();
    }
  }
}

// Display current frame on serial console
void displayCurrentFrame() {
  // Display frame
  //  terminal.println ("\nCurrent Frame");
  int idx = 0;
  for (int i = 0; i < 8; i++) {
    for (int j = 0; j < 8; j++) {
      terminal.print( frame[idx] );
      terminal.print( " " );
      idx += 1;
    }
    terminal.println("");
  }
  terminal.println("*");
}

// Record MAX_FRAMES, as fast as possible
void recordHighSpeedFrames(int frameDelayTime) {
  long startTime = millis();

  for (int curFrame = 0; curFrame < MAX_FRAMES; curFrame++) {
    // Read one frame
    readTileFrame();

    // Store frame
#ifdef _8BIT
    for (int a = 0; a < 64; a++) {
      frames[curFrame][a] = frame[a] >> 2;
    }
#else
    for (int a = 0; a < 64; a++) {
      frames[curFrame][a] = frame[a];
    }
#endif

    if (frameDelayTime > 0) {
      delay(frameDelayTime);
    }
  }

  long endTime = millis();
  terminal.print("Framerate: ");
  terminal.println((float)MAX_FRAMES / ((float)(endTime - startTime) / 1000.0f));
}

// Playback the high speed frames stored
void playbackHighSpeedFrames() {

  for (int curFrame = 0; curFrame < MAX_FRAMES; curFrame++) {
    // Display frame
    //    terminal.print ("\nFrame ");
    //    terminal.println (curFrame);

    int idx = 0;
    for (int i = 0; i < 8; i++) {
      for (int j = 0; j < 8; j++) {
        terminal.print( frames[curFrame][idx] );
        terminal.print( " " );
        idx += 1;
      }
      terminal.println("");
    }
    terminal.println("*");
    delay(50);
  }
}

long startTime = 0;

void setup() {
  // Setup pin modes
  pinMode(PIN_CLR, OUTPUT);
  pinMode(PIN_CLK, OUTPUT);

  // AD7940 ADC Pin modes
  pinMode(AD7940_SPI_CS, OUTPUT);
  pinMode(AD7940_SPI_CLK, OUTPUT);
  pinMode(AD7940_SPI_MISO, INPUT);

  // Setup initial states
  incrementCounter();
  clearCounter();

  // initialize serial:
  terminal.begin(115200);
  while(!terminal); //Wait for user to open this terminal. Useful for SAMD21 and boards that use CDC.

  terminal.println ("Initializing.... Press L (live) or H (high speed), 1, 2, 3, or S (idle)");

  clearCounter();
  incrementCounter();
  delay(100);

  startTime = millis();
}

void loop() {

  //Parse serial data (if any)
  if(terminal.available())
  {
    byte incoming = terminal.read();

    if (incoming == 'L') {
      terminal.println("Live");
      curMode = MODE_LIVE;

    } else if (incoming == 'H' || incoming == '1') {
      terminal.println("High-speed Save1");
      curMode = MODE_HIGHSPEED1;

    } else if (incoming == '2') {
      terminal.println("High-speed Save2 (1000hz)");
      curMode = MODE_HIGHSPEED2;

    } else if (incoming == '3') {
      terminal.println("High-speed Save3 (500hz)");
      curMode = MODE_HIGHSPEED3;

    } else if (incoming == '4') {
      terminal.println("High-speed Save4 (250hz)");
      curMode = MODE_HIGHSPEED4;

    } else if (incoming == 'S') {
      terminal.println("Idle");
      curMode = MODE_IDLE;

    } else if (incoming == 'P') {
      terminal.println("Read Pixel 0,0");
      curMode = MODE_PIXEL;
    }
  }

  /*
     Take action based on current mode
  */
  if (curMode == MODE_LIVE) {
    readTileFrame();
    displayCurrentFrame();

  } else if (curMode == MODE_HIGHSPEED1) {
    // Full/maximum speed
    recordHighSpeedFrames(0);
    playbackHighSpeedFrames();
    curMode = MODE_IDLE;

    terminal.println ("Initializing.... Press L (live) or H (high speed), 1, 2, 3, or S (idle)");

  } else if (curMode == MODE_HIGHSPEED2) {
    // ~1000Hz
    recordHighSpeedFrames(1);
    playbackHighSpeedFrames();
    curMode = MODE_IDLE;

    terminal.println ("Initializing.... Press L (live) or H (high speed), 1, 2, 3, or S (idle)");

  } else if (curMode == MODE_HIGHSPEED3) {
    // ~500Hz
    recordHighSpeedFrames(2);
    playbackHighSpeedFrames();
    curMode = MODE_IDLE;

    terminal.println ("Initializing.... Press L (live) or H (high speed), 1, 2, 3, or S (idle)");

  } else if (curMode == MODE_HIGHSPEED4) {
    // ~250Hz
    recordHighSpeedFrames(4);
    playbackHighSpeedFrames();
    curMode = MODE_IDLE;

    terminal.println ("Initializing.... Press L (live) or H (high speed), 1, 2, 3, or S (idle)");

  } else if (curMode == MODE_PIXEL) {
    //Read single pixel. Good for testing.

    curMode = MODE_IDLE;

    terminal.println ("Initializing.... Press L (live) or H (high speed), 1, 2, 3, or S (idle)");
  }

  //delay(10);
}
Note
There is also an example for Diligent's chipKIT Max32! For users that are interested in using the board, the example code is in the chipkit folder.
Note
For users that are using a SAMD51, you will need to adjust Serial:
#define terminal Serial //Use with Uno, SAMD51, Chipkit
//#define terminal SerialUSB //Use with SAMD21
You will also need to adjust the pin definitions:
//On Arduino Unos and Red Boards this is the SPI pinout
/*
const byte PIN_CLR = 8;
const byte PIN_CLK = 9;
const byte AD7940_SPI_MISO = 12;
const byte AD7940_SPI_CS = 10;
const byte AD7940_SPI_CLK = 13;
*/

// Pins for SAMD51

const byte PIN_CLR = 5;
const byte PIN_CLK = 9;
const byte AD7940_SPI_MISO = 22;
const byte AD7940_SPI_CS = 10;
const byte AD7940_SPI_CLK = 24;
After uploading the code, open the Serial Monitor or terminal emulator of your choice with the baud rate set to 115200. Enter a character (L , H , 1 , 2 , 3, and S ) to select the mode. In this case, we set the mode to live.
 |
| Select Mode |
The output will then begin output the readings.
 |
| Arduino IDE with Output, No Magnet |
Grab a magnet and place it near the sensor. In this case, the magnet was placed over the hall effect sensor at (0,0). The magnitude of the value will depend on the orientation of the magnet and the strength of the magnet. In this case, the magnitude was greater around (0,0) whenever the south pole was near the hall effect sensors.
 |
| Arduino IDE with Output, Magnet Over (0,0) |
Tip
For those that are interested in finding the polarity of your unlabeled magnet, there are several tests to determine the polarity of each end of the magnet. One method is using a compass. If the north pole is pointing toward one end of the magnet, the end of the magnet is the south pole. If the south pole is pointing toward one end of the magnet, the end of the magnet is the north pole.
If you know where the geographic north pole is, you can also attach the magnet to a string to determine its polarity. As the magnet is dangling from the string so that the poles are horizontal with respect to the floor. The south pole of the magnet will point toward the geographic north pole. Placing the magnet on a plastic lid over a bowl of water will also have the same results.
Rotating the magnet to the other pole and place it over (0,0) again. In this case, the value was lower around (0,0) whenever the north pole was near the hall effect sensors.
 |
| Arduino IDE with Output, Magnet North Over (0,0) |
Try moving the magnet to a different location near the array of hall effect sensors to track the magnetic field. In this case, we moved it to (7,7). If you inspect the values, you will notice that the magnet was also rotated so that the south pole was over the hall effect sensors. In this case, the magnitude was greater around (7,7).
 |
| Arduino IDE with Output, Magnet Over (7,7) |
Rotating the magnet back to the north pole at (7,7) will result in the opposite effect where the values were lower around (0,0). This is similar to what was observed earlier.
 |
| Arduino IDE with Output, Magnet North Over (7,7) |
Looking for a more visual output? We'll use this example loaded on the Arduino to visualize the output through the Processing IDE!
Setting Up Processing
Processing is a software that enables visual representation of data, among other things. If you've never dealt with Processing before, we recommend you also check out the Arduino to Processing tutorial. Follow the below button to download and install Processing.
Processing Example
This example also is located in the Magnetic Imaging Tile's Hardware Repo. To grab it, go ahead and download or clone the SparkFun Magnetic Imaging Tile hardware repo if you have not already.
Upload Arduino Example
Processing listens for serial data, so we'll need to get our microcontroller to produce serial data that makes sense to Processing. In this case, we will be using the Arduino example to output basic readings from earlier.
|
| Arduino IDE with Output |
Note
There is also an example for Diligent's chipKIT Max32! For users that are interested in using the board, the example code is in the chipkit folder.
Run the "MagTile Processing Visualization" Processing Example
Once this sketch is uploaded and a mode has been selected, we need to tell Processing how to turn this data into a visualization. The Processing sketch to do this is located one folder above the Arduino sketch: ... SparkFun_Magnetic_Imaging_Tile > Software > Processing > magtile_processing_visualization > magtile_processing_visualization.pde. Open the magtile_processing_visualization.pde file in Processing.
You can also copy and paste the following code in the Processing IDE as well.
// Magnetic Imager Tile v3 Processing Visualization
// This code is intended to pair with the Arduino/Chipkit code for reading data
// from the magnetic imager tile v3, and streaming it through a Serial port.
//
// Two 8x8 grids are shown: a normal gain (top) and high-gain (bottom).  The
// high-gain is particularly useful for low-intensity fields.
//
// Keys (lower-case):
//   L  - Live mode.  Press this to start streaming data live from the tile.
//  1-4 - High-speed capture.  Capture a number of high-speed frames (set in
//        the Chipkit code) from the tile, and stream them back.  Note that
//        the actual framerate will depend upon the code/platform/ADC.  The
//        values displayed here (1 ~= ~2000Hz, 4 ~= 250Hz) are calibrated
//        from my Chipkit MAX32 platform, and may vary quite a bit if you're
//        using a different platform or code.
//   C  - When in LIVE mode, it's possible to press 'C' and calibrate out
//        the background level for each tile, to reduce the noise.  If you
//        do this, ensure that no fields are present on the tile.
//        Alternatively: If a static field is present on the tile, this
//        will help show changes to that static field.
//
// Serial port: The serial port index is hard-coded in, and you will likel
//  have to change this for your platform.  See the //## comment marker in
//  the setup() function.
//


import processing.serial.*;

// Serial port vairables.
Serial myPort;  // Create object from Serial class
int val;        // Temporary variable storing data received from the serial port

// Array of x/y coordinates recieved over serial port.  Maximum number of recordings to store is MAX_RECORDINGS.
int MAX_SIZE = 8;
int[][] data = new int[MAX_SIZE][MAX_SIZE];
int curDataIdx = 0;      // Index of array element that has highest populated value (-1)

// Font (for drawing text)
PFont fontA;

// Screenshot index (for taking screenshots).
int screenshot_number = 0;

int numCalibFrames = 0;
int maxCalibFrames = 200;
int calibrationEnabled = 0;
int[][] dataCalib = new int[MAX_SIZE][MAX_SIZE];
int isCalibrated = 0;

String curText = "text";


// Called whenever there is serial data available to read
void serialEvent(Serial port) {
  // Data from the Serial port is read in serialEvent() using the readStringUntil() function with * as the end character.
  String input = port.readStringUntil(char(10));

  if (input != null) {
    // Helpful debug message: Uncomment to print message received
    println( "Receiving:" + input);
    input = input.trim();
    int split_point = input.indexOf(' ');
    if (split_point <= 0) {
      curDataIdx = 0;
      return;        // If data does not contain a comma, then disregard it.
    } else {
      // Parse data
      // The data is split into an array of Strings with a comma or asterisk as a delimiter and converted into an array of integers.
      float[] vals = float(splitTokens(input, " "));
      if (vals.length != MAX_SIZE) return;

      // Store data
      for (int i=0; i<MAX_SIZE; i++) {
        data[curDataIdx][i] = int(vals[i]);

        if (calibrationEnabled == 1) {
          dataCalib[curDataIdx][i] += int(vals[i]);
        }
      }

      // Increment index that we store new data at.
      curDataIdx += 1;
      if (curDataIdx >= MAX_SIZE) {
        curDataIdx = 0;

        if (calibrationEnabled == 1) {
          numCalibFrames += 1;

          if (numCalibFrames > maxCalibFrames) {
            calibrationEnabled = 0;
            calibration();
          }
        }
      }

      // Helpful debug message: Display serial data after parsing.
      //println ("Parsed x:" + x + "  y:" + y);
    }
  }

  /*
      // Mask
    for (int i=0; i<12; i++) {
      for (int j=0; j<12; j++) {
        if ((i >= 2) && (i<= 7) && (j >= 2) && (j <= 9)) {
          if (j == 9) {
            data[i][j] = 400 - data[i][j];
          }
          // keep existing data
        } else {
          data[i][j] = 200;
        }
      }
    }
  */

}


void calibration() {

  println("Calibration Data:");
  for (int i=0; i<MAX_SIZE; i++) {
    for (int j=0; j<MAX_SIZE; j++) {
      dataCalib[i][j] = floor((float)dataCalib[i][j] / (float)maxCalibFrames);
      print (dataCalib[i][j] + "  ");
    }
    println("");
  }

  isCalibrated = 1;
  curText = "";


}

// Draws a shape at each x/y location sent over the serial port.
// Only draws the last N locations, where N is equal to MAX_RECORDINGS (i.e. the size of the data array).
void draw_stored_data() {
    int pixelsize = 30;                // Size of shape to draw

    int offset_x = 10;
    int offset_y = 10;

    float MAX_VALUE_CALIB = 330.0f;  // Chipkit internal ADC
    float MAX_VALUE = 660.0f;        // Chipkit internal ADC

    //float MAX_VALUE = 400.0f;  // internal ADC
    //float MAX_VALUE = 7000.0f; // 14-bit external ADC


    for (int i=0; i<MAX_SIZE; i++) {
      for (int j=0; j<MAX_SIZE; j++) {
        int y = (MAX_SIZE-i) * pixelsize;
        int x = (MAX_SIZE-j) * pixelsize;

        if (isCalibrated == 1) {
          //float value = (float)data[i][j] / MAX_VALUE;
          float value = ((float)data[i][j] - (float)dataCalib[i][j])/ MAX_VALUE;

          //float intensity = int(floor(255 * abs(value - 0.50f)));
          float intensity = int(255 * value);
          if (value < 0.0) {
            fill(-intensity, 0, 0);
            //stroke(value);
          } else {
            fill(0, intensity, 0);
            //stroke(value);
          }

        } else {
          float value = (float)data[i][j] / MAX_VALUE;

          float intensity = int(floor(255 * abs(value - 0.50f)));
          if (value < 0.50) {
            fill(intensity, 0, 0);
            //stroke(value);
          } else {
            fill(0, intensity, 0);
            //stroke(value);
          }


        }
        rect(x + offset_x, y + offset_y, pixelsize, pixelsize);
      }
    }

    // Higher sensitivity
    offset_y = 450;
    for (int i=0; i<MAX_SIZE; i++) {
      for (int j=0; j<MAX_SIZE; j++) {
        int y = (MAX_SIZE-i) * pixelsize;
        int x = (MAX_SIZE-j) * pixelsize;

        if (isCalibrated == 1) {
          float value = ((float)data[i][j] - (float)dataCalib[i][j])/ MAX_VALUE;

          float intensity = int(3000 * value);

          if (value < 0.0) {
            fill(-intensity, 0, 0);
            //stroke(value);
          } else {
            fill(0, intensity, 0);
            //stroke(value);
          }

        } else {
        float value = (float)data[i][j] / MAX_VALUE;

        float intensity = int(floor(3000 * abs(value - 0.50f)));

        if (value < 0.50) {
          fill(intensity, 0, 0);
          //stroke(value);
        } else {
          fill(0, intensity, 0);
          //stroke(value);
        }

        }
        rect(x + offset_x, y + offset_y, pixelsize, pixelsize);
      }
    }

}


// This function runs a single time after the program beings.
void setup() {
  size(600, 800);                    // Window size
  //colorMode(HSB, 255, 255, 255);     // Colour space

  // Initialize Serial Port
  println ("Available Serial Ports:");
  println (Serial.list());                     // Display a list of ports for the user.
  String portName = Serial.list()[1];          //## Change the index (e.g. 1) to the index of the serial port that the
                                               // Arduino is connected to.
  print ("Using port: ");                      // Display the port that we are using.
  println(portName);
  println("This can be changed in the setup() function.");
  myPort = new Serial(this, portName, 115200);   // Open the serial port. (note, the baud rate (e.g. 9600) must match
                                               // the baud rate that the Arduino is transmitting at).

  // Initialize font
  fontA = createFont("Arial-black", 20);
  textFont(fontA, 20);

  // Initialize data array  (set all elements to zero).
  for (int i=0; i<MAX_SIZE; i++) {
    for (int j=0; j<MAX_SIZE; j++) {
      data[i][j] = 250;
    }
  }

  // Send command


}


// This function runs repeatedly, like the loop() function in the Arduino language.
void draw() {

  background(255, 255, 255);             // Set background to white

  // At each iteration, draw the data currently specified in the 'data' array to the screen.
  draw_stored_data();

  // Note: Serial data is updated in the background using the serialEvent() function above, so we don't
  // have to explicitly look for it (or parse it here).

  textAlign(CENTER);
  fill(0);
  text(curText, 150, 400);

}


// This is another interrupt function that runs whenever a key is pressed.
// Here, as an example, if the space key (' ') is pressed, then the program will save a screenshot.
// If the 'a' key is pressed, then the program will clear the data history.
void keyPressed() {
  // Press <space>: Save screenshot to file.
  if (key == ' ') {
   saveFrame("screenshot-" + screenshot_number + ".png");
   screenshot_number += 1;
  }

  // Press 'a': Clear data array
  if (key == 'a') {
    for (int i=0; i<MAX_SIZE; i++) {
      for (int j=0; j<MAX_SIZE; j++) {
        data[i][j] = 0;
      }
    }
    curDataIdx = 0;
  }

  if (key == 'l') {
    myPort.write('L');
    myPort.write('\n');
    curText = "Live Feed";
  }
  if (key == 'h') {
    myPort.write('H');
    myPort.write('\n');
  }
  if (key == 's') {
    myPort.write('S');
    myPort.write('\n');
    curText = "Idle";
  }

  if (key == '1') {
    myPort.write('1');
    myPort.write('\n');
    curText = "2000Hz capture";
  }
  if (key == '2') {
    myPort.write('2');
    myPort.write('\n');
    curText = "1000Hz capture";
  }
  if (key == '3') {
    myPort.write('3');
    myPort.write('\n');
    curText = "500Hz capture";
  }
  if (key == '4') {
    myPort.write('4');
    myPort.write('\n');
    curText = "250Hz capture";
  }

  if (key == 'c') {
    for (int i=0; i<MAX_SIZE; i++) {
      for (int j=0; j<MAX_SIZE; j++) {
        dataCalib[i][j] = 0;
      }
    }
    numCalibFrames = 0;
    calibrationEnabled = 1;
    curText = "Calibrating";
  }

  if (key == 'd') {
    println("Calibration Data:");
    for (int i=0; i<MAX_SIZE; i++) {
      for (int j=0; j<MAX_SIZE; j++) {
        print (dataCalib[i][j] + "  ");
      }
      println("");
    }
  }

}
Attempting to run the Processing sketch will show us available serial ports in the debug window from this line of code, where portName is defined as a string:
Identify which serial port your Arduino is on. For instance, my SparkFun RedBoard Turbo is on COM10, which corresponds to the 8th element in the array as [7]. So I will need to change 1 to 7 where portName is defined to ensure that Processing is listening to the correct serial port.
 |
| Adjusting Processing Example's Serial Port |
Once we've done this, we should be able to run the Processing sketch and it will give us a nice visualization of the magnetic fields in range of the Magnetic Imaging Tile. Send a character to set the mode. By sending a lower case l in the window with the visualization will set it to live mode and begin streaming data live from the tile. As explained in the example code, the top 8x8 grid will display the normal gain. The bottom 8x8 grid will display a high gain. Place a magnet near the array of hall effect sensors. In this case, a magnet was placed over (0,0) as shown in the Processing Console's serial output. The grid in this case did not show any changes.
 |
| Processing Output, Magnet Over (0,0) |
Rotating the magnet to the other pole and place it over (0,0) again. In this case, the change was more apparent as we are able to view the magnetic fields in red. If you know the polarity of the magnet as explained earlier in the Arduino example, you will notice that the squares that have a red color are lower in magnitude whenever the magnet's north pole is placed over the hall effect sensor.
 |
| Processing Output, Magnet North Over (0,0) |
Rotating the magnet back to the other pole and place it to a different position near the array of hall effect sensors. In this case, the magnet was placed around (7,7) and did not show as much of a change in the 8x8 grid.
 |
| Processing Output, Magnet Over (7,7) |
Rotate the magnet to the other pole and place it around (7,7). In this case, we are able to view the magnetic fields in red again.
 |
| Processing Output, Magnet North Over (7,7) |
When in live mode, it's also possible to calibrate out the background level for each tile to reduce the noise in the Processing example. Send a lower case c in the window with the visualization. When calibrating, ensure that there are no magnetic fields present around the tile. After a few seconds, the visualization will show a different color in the 8x8 grid.
 |
| Processing Output, Calibrated |
Place a magnet over (0,0). In this case, the change was apparent with both sides of the magnet where the magnet's south pole was shown with green and the magnet's north pole was shown with red.
 |
 |
| Processing Output, Calibrated with Magnet Over (0,0) | Processing Output, Calibrated with Magnet North Over (0,0) |
Place the magnet over (7,7). You should see something similar like the images below. The color of the magnetic field in the grid will depend on the orientation of the magnet.
 |
 |
| Processing Output, Calibrated with Magnet Over (7,7) | Processing Output, Calibrated with Magnet North Over (7,7) |
Now that we can see the magnetic fields from a magnet, try grabbing an object nearby to see if you can view any magnetic fields!
 |
 |
| Processing Output with a Magnet Moving over the Magnetic Imaging Tile |
Processing Output with a Fan Rotating over the Magnetic Imaging Tile |
Note
If you look closely at the GIF with a magnet, you will notice that there is a magnetic field on the upper left of the Processing output when the magnet is placed over the Magnetic Imaging Tile. However, the Magnetic Imaging Tile is rotated 90° clockwise with respect to the Processing output as the magnet is placed over the hall effect sensor at (7x7).
Troubleshooting
General Troubleshooting Help
Note
Not working as expected and need help?
If you need technical assistance and more information on a product that is not working as you expected, we recommend heading on over to the SparkFun Technical Assistance page for some initial troubleshooting.
If you don't find what you need there, the SparkFun Forums are a great place to find and ask for help. If this is your first visit, you'll need to create a forum account to search product forums and post questions.
Resources
Now that you've successfully got your SparkFun Magnetic Imaging Tile up and running, it's time to incorporate it into your own project! For more information, check out the resources below:
- Schematic (PDF)
- Eagle Files (ZIP)
- Board Dimensions (PNG)
- Component Datasheets
- Fritzing Part
- Examples
- GitHub Hardware Repo