Viewing and Downloading Log Files using the IoT Web Server
As of firmware v01.02.00, log files can be viewed and downloaded over a WiFi network! This saves you time by allowing you to download the files without the need to disconnect the DataLogger IoT and manually remove microSD card.
The following is covered by this document:
- How a user configures and uses the HTTP connection
- Use examples
IoT Web Server Connection Setup
To connect to the ESP32's IoT Web Server, the following information is needed:
- The server name/address
- [optional] A username - if required
- [optional] A password - if required
IoT Web Server Menu System
We'll need to adjust the settings for the IoT Web Server.
For users that are interested in using the menu system, open a Serial Terminal, connect to the COM port that your DataLogger enumerated to, and set it to 115200 baud. In this case, we connected to COM13. Press any key to enter the Main Menu. Type 1 to enter the Settings menu. Then type 17 to enter the IoT Web Server Menu. When the menu system for the IoT Web Server is presented, the following options are displayed:
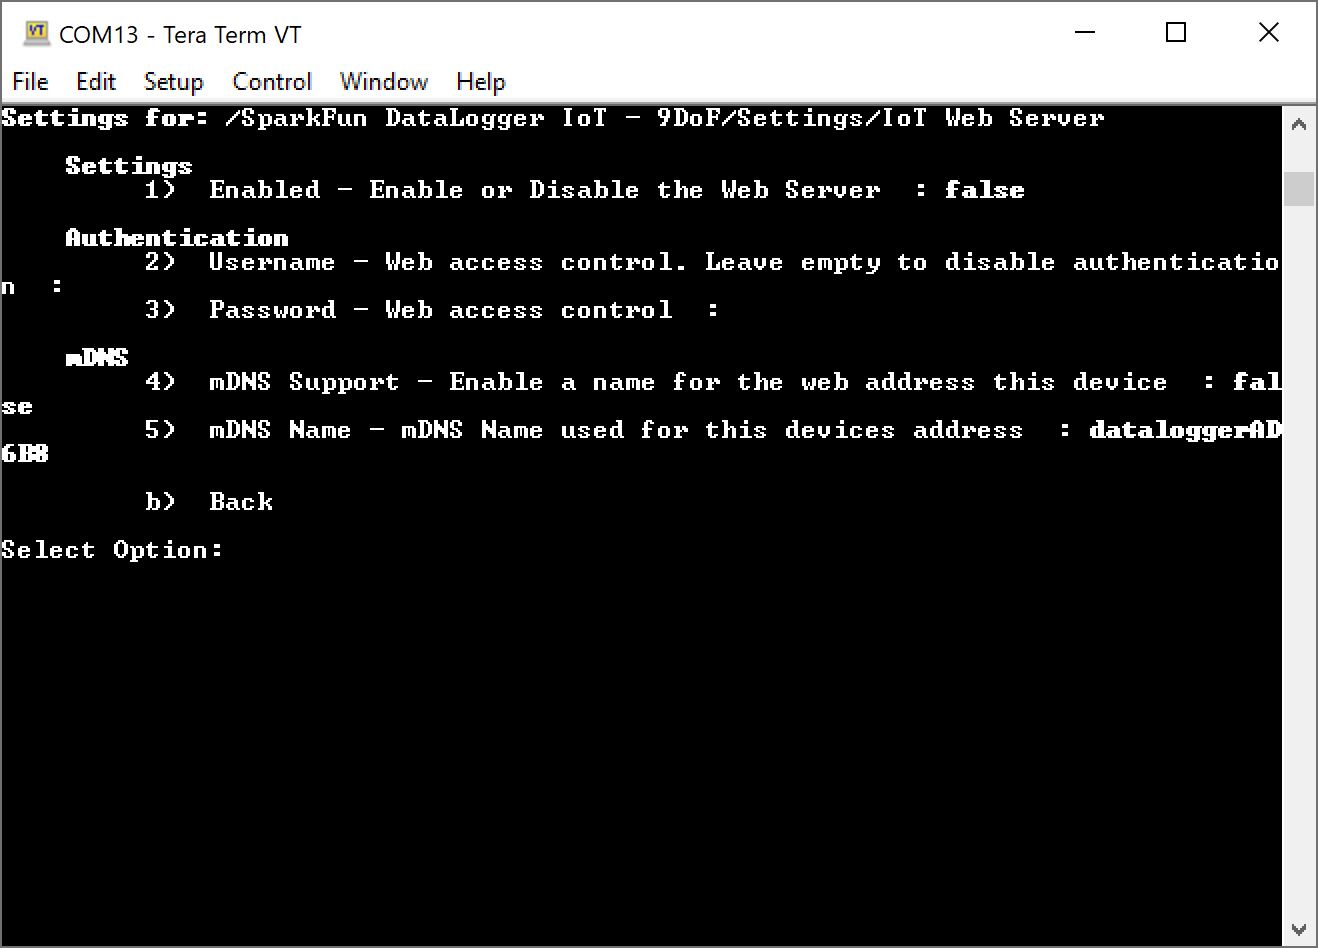
The options are:
- Enable/Disable the connection
- Username
- Password
- Enable/Disable mDNS support
- mDNS name
At a minimum, you will just need to enable the connection. However, we recommend enabling mDNS support if it is supported in your network.
Once all these values are set, the system will serve the log files in your local 2.4GHz WiFi network following the JSON information structure noted below in this document.
JSON File Entries
If a JSON file is being used as an option to import settings into the DataLogger IoT, the following entries are used for the IoT web server:
"IoT Web Server": {
  "Enabled": false,
  "Username": "",
  "Password": "",
  "mDNS Support": false,
  "mDNS Name": "dataloggerAD6B8"
},
Where:
Enabled- Set totrueto enable the connection.Username- Web server user name if being used.Password- Web server password if being used.mDNS Support- Set totrueif multicast DNS is supported. This allows you to enter the address as "http://dataloggerXXXXX.local" (whereXXXXXis generated from the last 5x characters from your board ID) rather than typing the exact IP address of the ESP32.mDNS Name- Multicast DNS name. In this case, the default name was set todataloggerAD6B8. This name will be different depending on your DataLogger IoT's board ID soAD6B8will be different for your board.
Tip
To load the values by the system at startup using a JSON file and microSD card, you will need to configure the Save Settings. This JSON file will be created with the "Save to Fallback" option. Make sure to enable the MQTT Client as well.
Connect and Download Log File
Note
You will need to make sure that the ESP32 is on the same network as your computer in order to access the log files.
Note
When authentication is enabled, some browsers might require a second login depending on user settings.
Once the web server is enabled and the settings are saved, you will need to reboot the DataLogger IoT. As the DatLogger initializes, it will connect to your WiFi Network. Take note of the mDNS address, in this case, it was "http://dataloggerAD6B8.local".
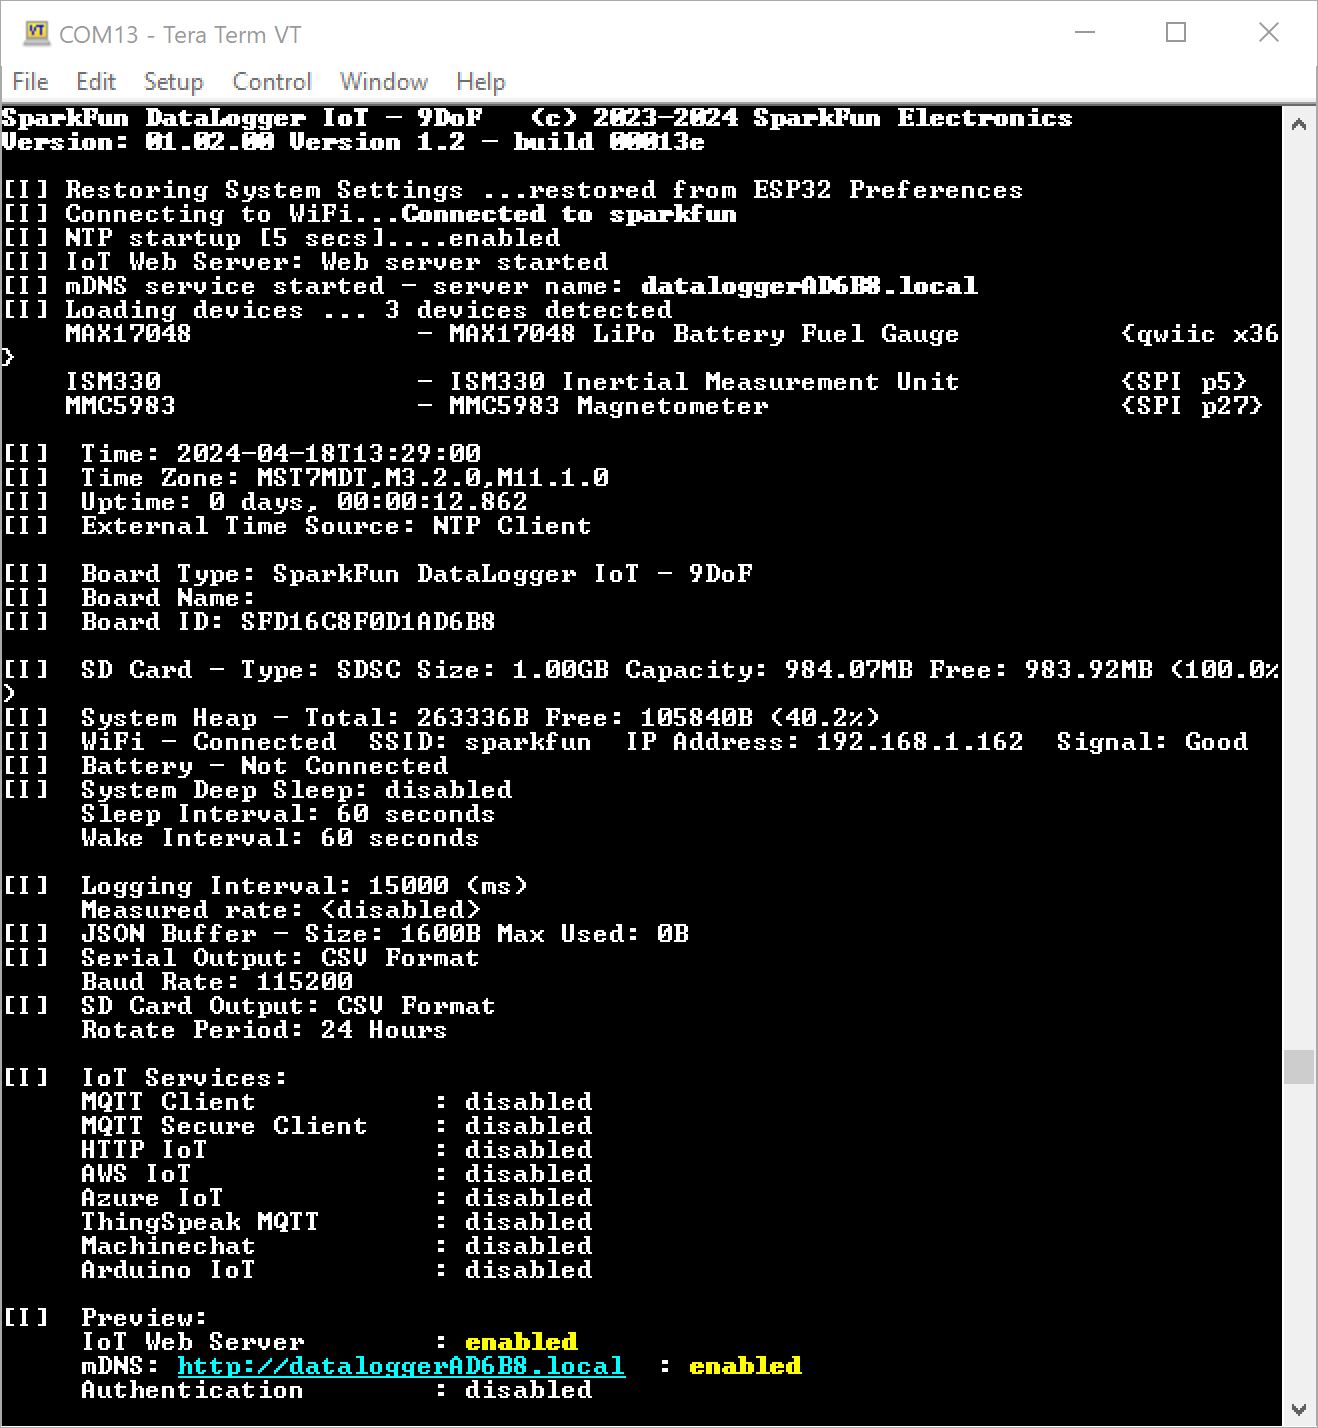
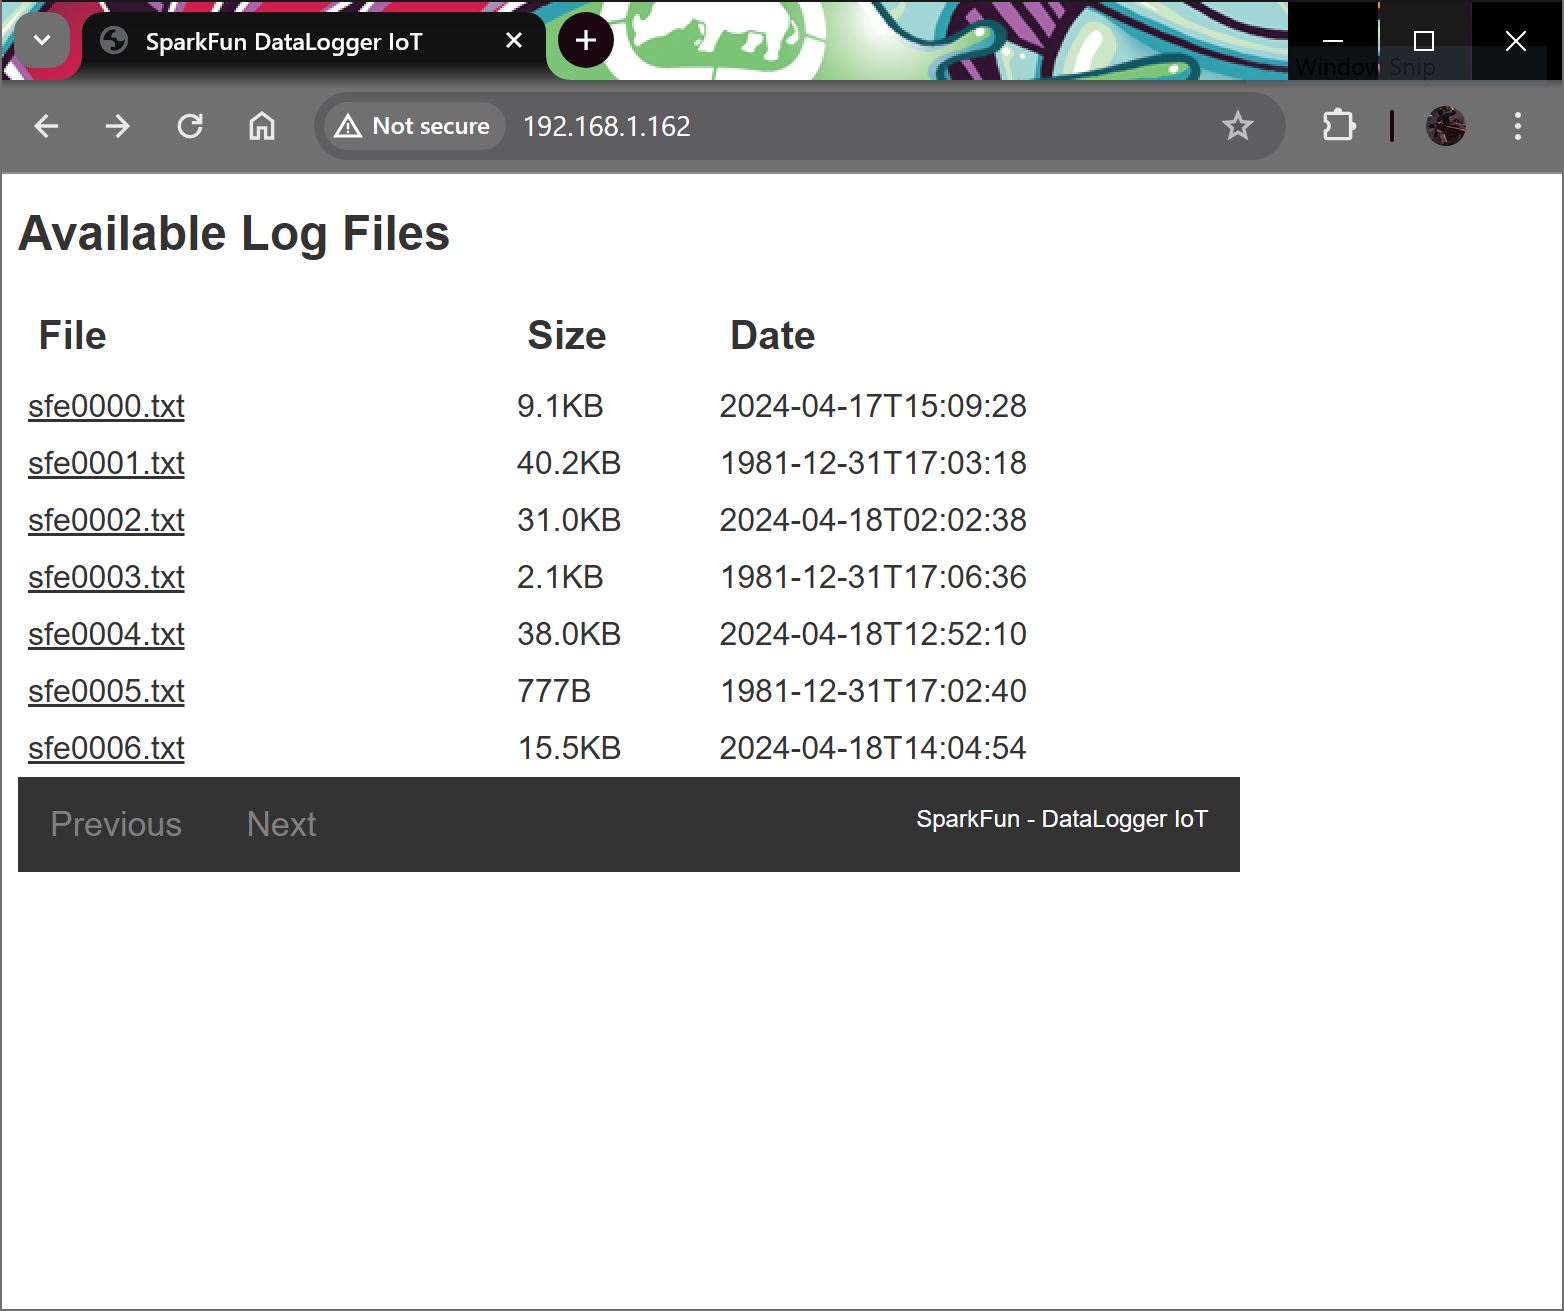
Once the DataLogger IoT has finished initializing, open web browser. Connect the DataLogger IoT by entering the address "http://dataloggerXXXXX.local", where XXXX is the last 5x characters of your board ID. You will be presented with the log files available on the microSD card. Click on a log file to download and save it to your computer.

Note
If mDNS is not supported, you can also enter the IP address of the Datalogger IoT into a web browser to view and download the log files. You can view the IP address when the DataLogger IoT is initializing. If you have administrative privileges to the WiFi Network, you can also view the IP address through your WiFi router as well.
Now that you have downloaded the log files, try graphing the data on a spreadsheet!